Multiple Choice
In the graph below, which depicts the relationship between units produced and total cost, the dotted line depicts which type of total cost? 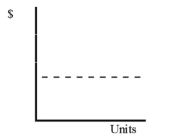
A) Variable cost
B) Fixed cost
C) Mixed cost
D) None of these
Correct Answer:

Verified
Correct Answer:
Verified
Related Questions
Q3: The contribution margin format income statement is
Q43: Operating leverage exists when:<br>A) a company utilizes
Q52: What is an activity base,and how does
Q85: The following income statements are provided
Q86: Based on the following cost data,
Q88: The following information is given regarding
Q94: Contribution margin income statements for two
Q98: How does fixed cost per unit behave
Q108: If a company shifts its cost structure
Q133: Wham Company sells electronic squirrel repellants for