Multiple Choice
Exhibit 10-2 The figure below shows a graph of angular velocity versus time for a man bicycling around a circular track. 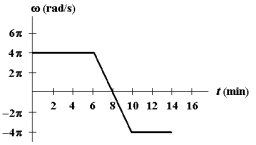 Use this exhibit to answer the following question(s) .
-Refer to Exhibit 10-2.What is his average angular acceleration,in rad/s2,in the first 10 minutes?
A) 0
B)
C)
D)
E)
Correct Answer:

Verified
Correct Answer:
Verified
Related Questions
Q82: A uniform rod (length = 2.4 m)
Q90: A thin uniform rod (length =
Q91: Five objects of mass m move
Q92: The graph below shows a plot
Q93: A puck on a frictionless air hockey
Q94: A nonuniform 2.0-kg rod is 2.0 m
Q96: A celestial object called a pulsar emits
Q97: A wheel (radius = 0.25 m)is mounted
Q98: A car of mass 1 000 kg
Q99: A solid cylinder rolls without slipping