Multiple Choice
Exhibit 10-3
The graph below shows a plot of angular velocity in rad/s versus time in s from t = 0 s to t = 7 s. 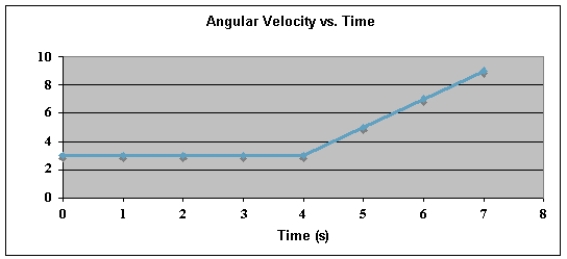 Use this exhibit to answer the following question(s) .
-Refer to Exhibit 10-3.The change in angular position, ,during the 7-second period is
A) 21 rad,CW.
B) 21 rad,CCW.
C) 30 rad,CW.
D) 30 rad,CCW.
E) 39 rad,CCW.
Correct Answer:

Verified
Correct Answer:
Verified
Q18: A horizontal force of magnitude 6.5 N
Q31: A small sphere attached to a light
Q110: Four identical particles (mass of each =
Q111: Exhibit 10-1 The figure below shows
Q112: The figure below shows a graph of
Q113: The rigid body shown is rotated about
Q114: In the figure,a 1.6-kg weight swings in
Q117: A particle located at the position
Q118: Two vectors lying in the xz
Q120: The rigid object shown is rotated about