Multiple Choice
Exhibit 10-3
The graph below shows a plot of angular velocity in rad/s versus time in s from t = 0 s to t = 7 s. 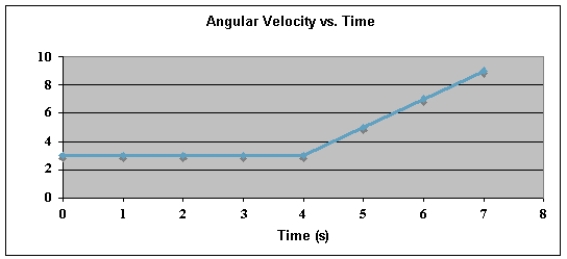 Use this exhibit to answer the following question(s) .
-Refer to Exhibit 10-3.The angular position, ,at t = 0 s is 3.0 rad,clockwise.The angular position, ,at t = 7 s is
A) 27 rad,CW.
B) 27 rad,CCW.
C) 33 rad,CW.
D) 33 rad,CCW.
E) 36 rad,CCW.
Correct Answer:

Verified
Correct Answer:
Verified
Q3: A solid sphere, a solid cylinder, and
Q9: Two forces of magnitude 50 N,as
Q10: Two objects of mass m<sub>1</sub> = 2m
Q12: What is the angular momentum of the
Q14: The angular speed of the hour
Q15: A particle whose mass is 2
Q16: A uniform rod (mass = 2.0
Q62: Identical particles are placed at the 50-cm
Q69: When a wheel is rolling without slipping,
Q80: A wheel rotates about a fixed axis