Multiple Choice
There were approximately 8.92 million unemployed workers in the United States.The circle graph shows the age profile of these unemployed workers.What is the probability that a person selected at random from the population of unemployed workers is in the 45-64 age group. 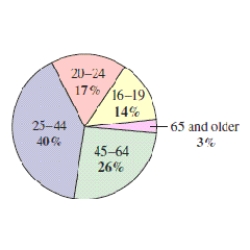
A)
B)
C)
D)
E) 60
Correct Answer:

Verified
Correct Answer:
Verified
Q37: You are given the probability that
Q38: You are given the probability that
Q39: The educational attainment of a country population
Q40: The figure shows the results of
Q41: The figure shows the results of
Q42: Determine the sample space for the experiment.<br>Three
Q43: There were approximately 42 million unemployed
Q44: 118 college students were interviewed to
Q45: The figure shows the results of a
Q47: Find the probability for the experiment