Multiple Choice
Select a scatter plot of the given data.
R t
A) 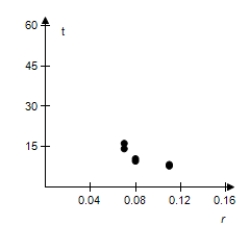
B) 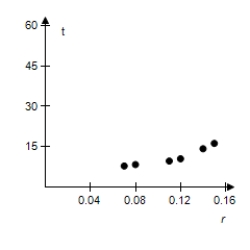
C) 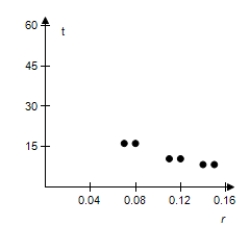
D) 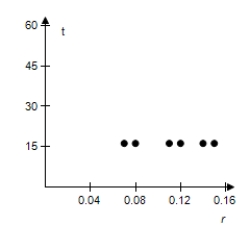
E) 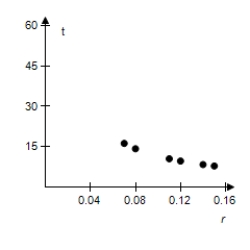
Correct Answer:

Verified
Correct Answer:
Verified
Related Questions
Q46: Find the exponential model <span
Q47: Complete the table for the radioactive
Q48: Find the exponential model <span
Q49: An initial investment of $5000 doubles in
Q50: Complete the table for the time
Q51: Complete the table for a savings
Q52: The population P (in thousands)of Reno,Nevada
Q53: Select the correct graph for the
Q54: The population P of a bacteria
Q56: Tritium,a radioactive isotope of hydrogen,has a half-life