Multiple Choice
Select a scatter plot of the given data. r
4%
6%
8%
10%
12%
14%
T
28) 01
18) 85
14) 27
11) 53
9) 69
8) 38
A) 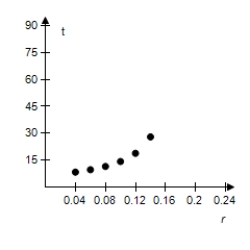
B) 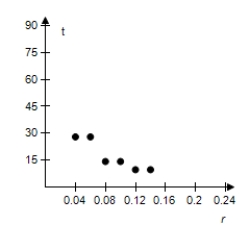
C) 
D) 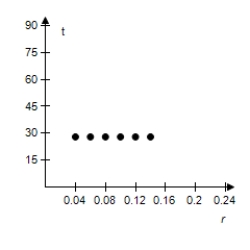
E) 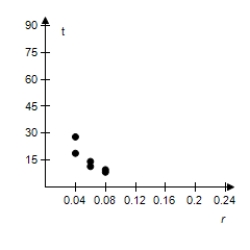
Correct Answer:

Verified
Correct Answer:
Verified
Related Questions
Q32: Find the intensity I of an
Q33: Select the correct graph for the
Q34: Complete the table for the radioactive
Q35: The population P of a culture
Q36: A population growing at an annual
Q38: Carbon dating presumes that,as long as
Q39: An initial investment of $2000 grows at
Q40: Select the correct graph for the
Q41: Complete the table for a savings
Q42: Complete the table for the time