Multiple Choice
A biology class performs an experiment comparing the quantity of food consumed by a certain kind of moth with the quantity supplied.The model for the experimental data is given by
Where x is the quantity (in milligrams) of food supplied and y is the quantity (in milligrams) of food consumed.
Select the correct graph of this model.
A) 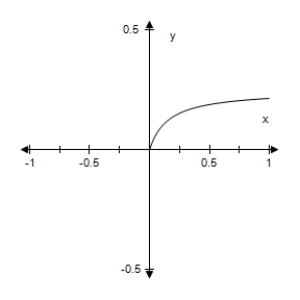
B) 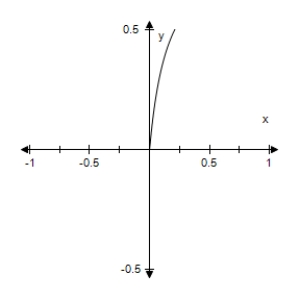
C) 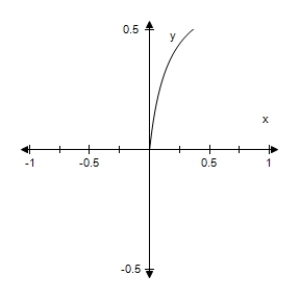
D) 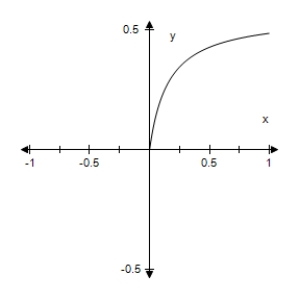
E) 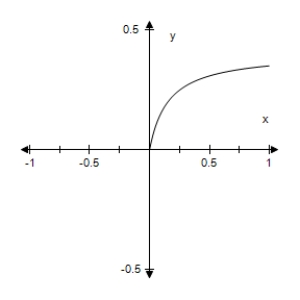
Correct Answer:

Verified
Correct Answer:
Verified
Q42: Determine the equations of any horizontal
Q43: Find vertical asymptotes of the following
Q44: Find the zeros (if any)of the
Q45: Find all intercepts of the following
Q46: Find the zeros of the rational
Q48: In a pilot project,a rural township
Q49: A biology class performs an experiment
Q50: Determine the value that the function
Q51: Find the domain of the function
Q52: Identify all intercepts of <span