Multiple Choice
The amounts A (in billions of dollars) donated to support higher education in the United States from 2000 through 2007 are shown in the table,where t represents the year,with t = 0 corresponding to 2000.
Use a graphing utility to select a correct a scatter plot of the above data.
A) 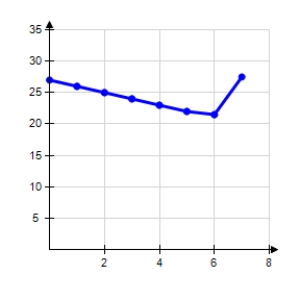
B) 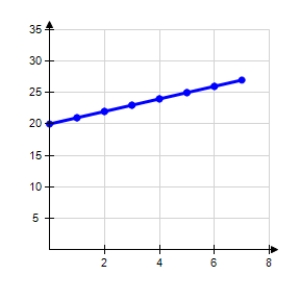
C) 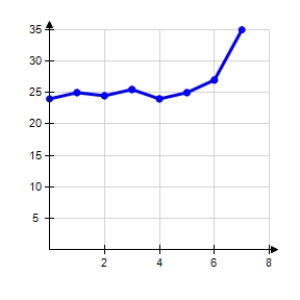
D) 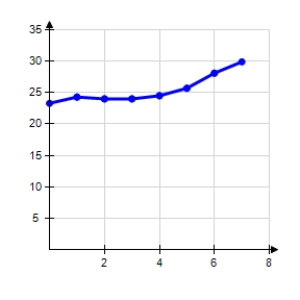
E) 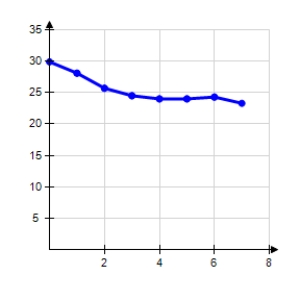
Correct Answer:

Verified
Correct Answer:
Verified
Related Questions
Q3: If x = -2 is a
Q4: Select the correct graph of the
Q5: Use synthetic division to perform the
Q6: Let <span class="ql-formula" data-value="P (
Q7: Use synthetic division to divide.
Q9: Use synthetic division to divide.
Q10: Use the Remainder Theorem and synthetic
Q11: Find all the real zeros of
Q12: Use Descartes' Rule of Signs to
Q13: Use synthetic division to divide.