Multiple Choice
The amounts A (in billions of dollars) donated to support higher education in the United States from 2000 through 2007 are shown in the table,where t represents the year,with t = 0 corresponding to 2000.
Use a graphing utility to create a scatter plot of the data.
A) 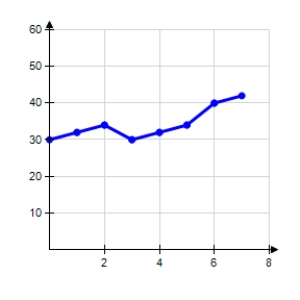
B) 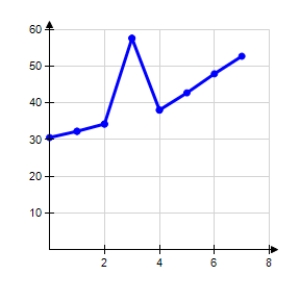
C) 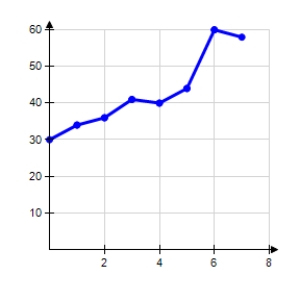
D) 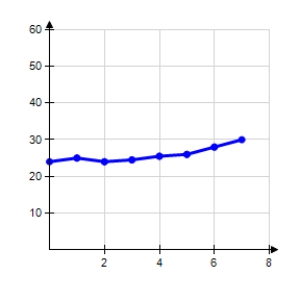
E) 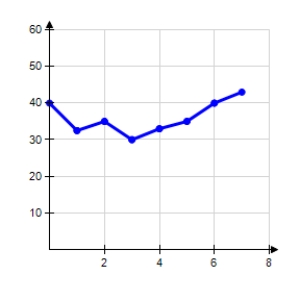
Correct Answer:

Verified
Correct Answer:
Verified
Related Questions
Q33: Use long division to divide.
Q34: Use long division to divide.
Q35: Select the correct graph of the
Q36: Use synthetic division to divide.
Q37: Simplify the rational expression, <span
Q39: Write <span class="ql-formula" data-value="f (
Q40: Use long division to divide.
Q41: Use long division to divide.
Q42: Use synthetic division to divide.
Q43: If x = <span class="ql-formula"