Multiple Choice
The graph shows the sales (in billions of dollars) for Apple Inc.for the years 2001 through 2007. 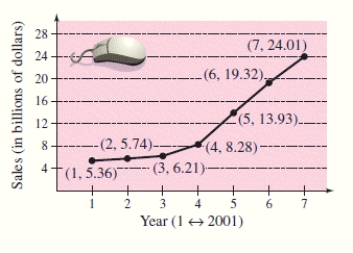 Find the slope of the line segment connecting the points for the years 2003 and 2004.Round the answer to two decimal places.
A) -5.07
B) 2.07
C) 7.07
D) 3.07
E) -2.07
Correct Answer:

Verified
Correct Answer:
Verified
Related Questions
Q26: Find the slope of the line through
Q27: Find the slope-intercept form of the
Q28: Find the slope and y-intercept (if
Q29: Write the equation of the line that
Q30: Find the y-intercept of the line
Q32: Carl's Tractor Service purchases a used
Q33: Write the equation of the line
Q34: The following is the slope of line
Q35: Find the slope-intercept form of the
Q36: Write the slope-intercept form of the