Multiple Choice
Graphically estimate the x- and y-intercepts of the graph.
Y = |x + 3| 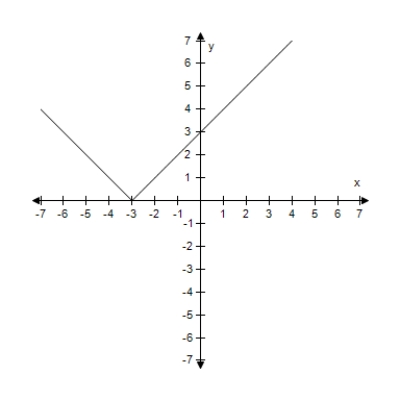
A) x-intercept: (-3,0) y-intercept: (0,3)
B) x-intercept: (0,-3) y-intercept: (3,0)
C) x-intercept: (0,-3) y-intercept: (0,3)
D) x-intercept: (3,0) y-intercept: (3,0)
E) x-intercept: (0,3) y-intercept: (3,0)
Correct Answer:

Verified
Correct Answer:
Verified
Related Questions
Q44: Graph the circle <span class="ql-formula"
Q45: Determine which point does not lie
Q46: Graphically estimate the x- and y-intercepts
Q47: Complete the table.Use the resulting solution
Q48: Find any x- or y-intercepts for
Q50: Use a graphing utility to graph
Q51: Use a graphing utility to graph
Q52: Find the value of y that corresponds
Q53: Use a graphing utility to graph
Q54: Find the x-intercept of the graph