Multiple Choice
Sketch a scatter plot of the data shown in the table. The table shows the number y of Wal-Mart stores for each year x from 2000 through 2007.
A) ? 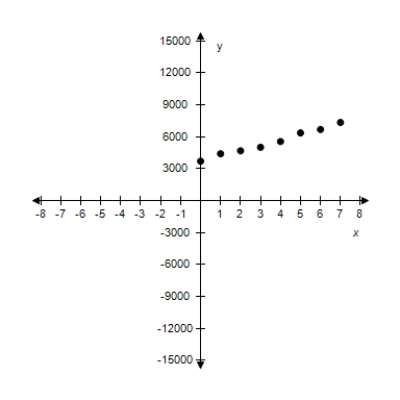 x: Year (0 ? 2000)
Y: Number of stores
B) ? 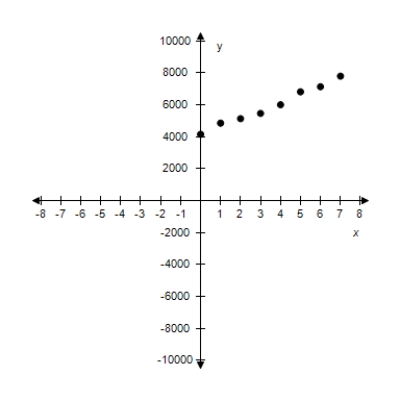 x: Year (0 ? 2000)
Y: Number of stores
C) ? 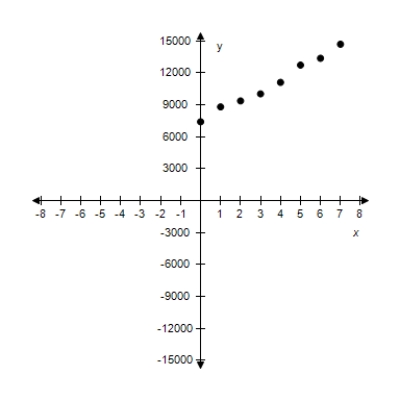 ?
?
X: Year (0 ? 2000)
Y: Number of stores
D) ? 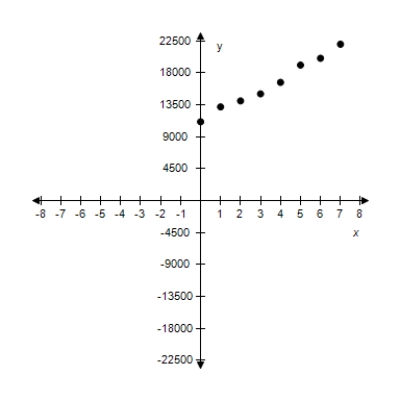 x: Year (0 ? 2000)
Y: Number of stores
E) ? 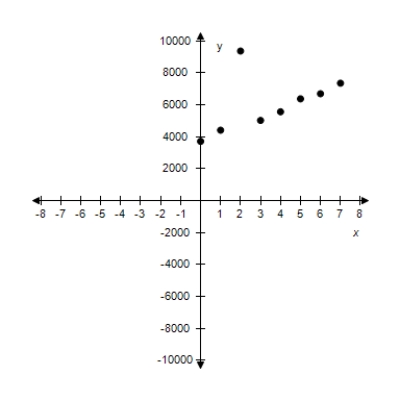 x: Year (0 ? 2000)
Y: Number of stores
Correct Answer:

Verified
Correct Answer:
Verified
Q15: Find the distance between the points.Round to
Q16: Find the midpoint of the line segment
Q17: Find the coordinates of the point that
Q18: Use the Midpoint Formula to estimate the
Q19: Determine the quadrant(s)in which (x,y)is located so
Q21: Find the coordinates of the vertices of
Q22: Plot the following points and find the
Q23: Plot the following points and find
Q24: Find the distance between the points.(Round the
Q25: Plot the following points and find the