Multiple Choice
Sketch a scatter plot of the data shown in the table. The table shows the lowest temperature on record y (in degrees Fahrenheit) in Duluth,Minnesota for each month x where x = 1 represents from January.
A) 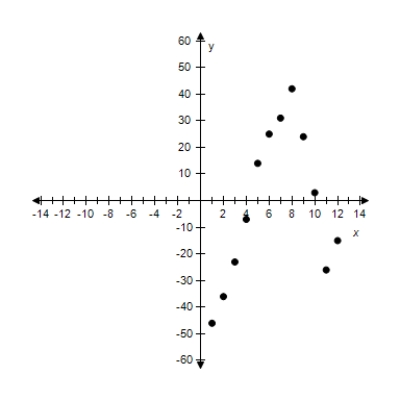 x: Months (1 ? January)
Y: Temperature (in Fº)
B) 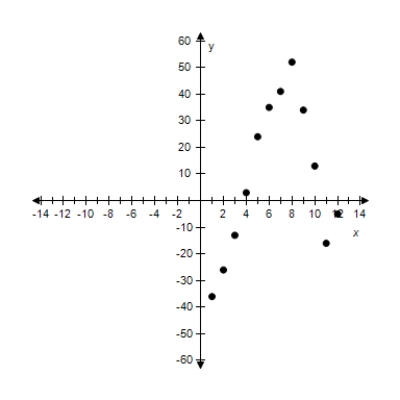 x: Months (1 ? January)
Y: Temperature (in Fº)
C) 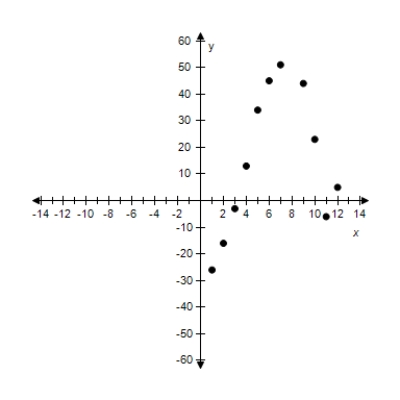 ?
?
X: Months (1 ? January)
Y: Temperature (in Fº)
D) 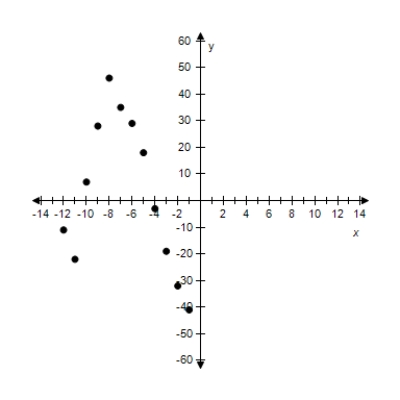 ?
?
X: Months (1 ? January)
Y: Temperature (in Fº)
E) 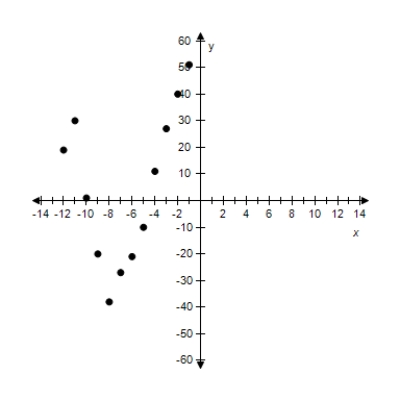 x: Months (1 ? January)
Y: Temperature (in Fº)
Correct Answer:

Verified
Correct Answer:
Verified
Q56: Plot the following points and find
Q57: Determine the quadrant(s)in which (x,y)is located so
Q58: A point is located six units to
Q59: Find the distance between the points
Q60: )Given points(5,-11),and (11,-5)form the vertices of the
Q62: Let M denote the midpoint of the
Q63: Plot the points in the Cartesian plane.
Q64: Plot the points in the Cartesian plane.
Q65: Given the points (-6,-8)and (4,-6).Find a third
Q66: Let S represent the midpoint between (5,3)and