menu-iconExamlexExamLexServices

Discover

Ask a Question
  1. All Topics
  2. Topic
    Biology
  3. Study Set
    Visual Anatomy and Physiology Study Set 1
  4. Exam
    Exam 11: Nervous Tissue
  5. Question
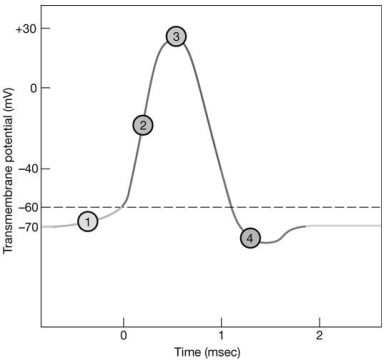
    Figure 11-2 -Which Area of the Graph Shows When Graded Hyperpolarization Is
Solved

Figure 11-2 -Which Area of the Graph Shows When Graded Hyperpolarization Is

Question 85

Question 85

Multiple Choice

  Figure 11-2 -Which area of the graph shows when graded hyperpolarization is occurring? A) 1 B) 2 C) 3 D) 4 Figure 11-2
-Which area of the graph shows when graded hyperpolarization is occurring?


A) 1
B) 2
C) 3
D) 4

Correct Answer:

verifed

Verified

Unlock this answer now
Get Access to more Verified Answers free of charge

Related Questions

Q20: Deteriorating changes in the distal segment of

Q45: The myelin sheath that covers many CNS

Q80: What determines the frequency of action potential

Q81: Neurons that have one axon and one

Q84: Define resting membrane potential.<br>A)Resting membrane potential is

Q86: If the sodium-potassium pumps in the plasma

Q87: Describe the neurilemma of a myelinating and

Q88: The effect that a neurotransmitter has on

Q89: In a(n)_ synapse,current flows directly between cells.<br>A)electrical<br>B)chemical<br>C)electrochemical<br>D)ionic<br>E)charged

Q122: Damage to ependymal cells would most likely

Examlex

ExamLex

About UsContact UsPerks CenterHomeschoolingTest Prep

Work With Us

Campus RepresentativeInfluencers

Links

FaqPricingChrome Extension

Download The App

Get App StoreGet Google Play

Policies

Privacy PolicyTerms of ServiceHonor CodeCommunity Guidelines

Scan To Download

qr-code

Copyright © (2025) ExamLex LLC.

Privacy PolicyTerms Of ServiceHonor CodeCommunity Guidelines