Multiple Choice
Scenario I
Examine Figure 2.1 and then answer the following questions. 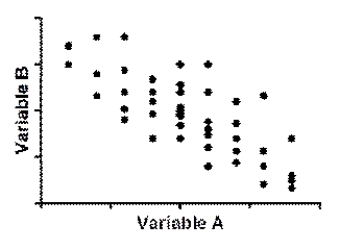
-(Scenario I) Each data point on the scatterplot represents:
A) a single participant's score on Variable A and B
B) a single participant's score on Variable B
C) the score on Variable B at the group mean of Variable A
D) the score on Variable A at the group mean of Variable B
Correct Answer:

Verified
Correct Answer:
Verified
Q1: Use the following to answer questions <br>Scenario
Q2: Scenario II<br>A psychologist was interested in the
Q3: Use the following to answer questions <br>Scenario
Q4: Scenario I<br>Examine Figure 2.1 and then answer
Q6: Use the following to answer questions <br>Scenario
Q9: Scenario I<br>Examine Figure 2.1 and then answer
Q10: Scenario I<br>Examine Figure 2.1 and then answer
Q10: Use the following to answer questions <br>Scenario
Q12: Use the following to answer questions <br>Scenario
Q12: Scenario I<br>Examine Figure 2.1 and then answer