Multiple Choice
Figure 11-A
Assuming the data in this figure are correct, use the data to answer the following questions. 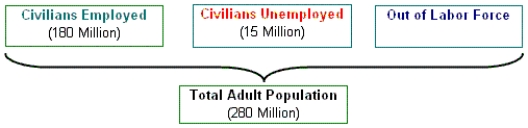
-Refer to Figure 11-A.From the data provided, the labor force participation rate is approximately ____ percent.
A) 69.6
B) 64.3
C) 92.3
D) 5.4
E) 78.5
Correct Answer:

Verified
Correct Answer:
Verified
Q4: Unemployment rises in _, and falls in
Q50: If firms pay employees an efficiency wage:<br>A)absenteeism
Q60: Which of the following is true?<br>A)A depression
Q81: A person who works part-time is considered
Q82: In the expansion phase of the business
Q89: Economists consider cyclical unemployment to be the
Q90: If the population older than 16 years
Q95: Discouraged workers are defined as those:<br>A)whose productivity
Q120: Which of the following is not a
Q158: Which of the following groups of people