Multiple Choice
Exhibit 4-B 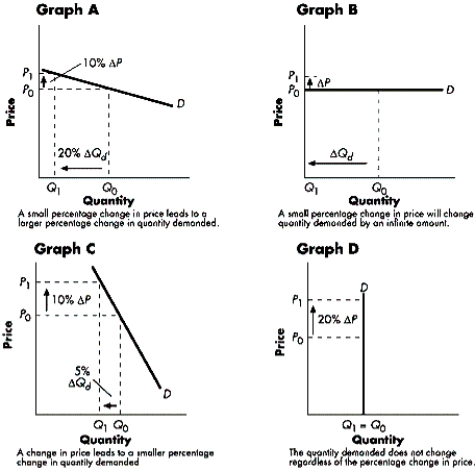
-Refer to Exhibit 4-B.The graph that best illustrates a relatively inelastic (but not perfectly inelastic) demand curve is:
A) Graph A.
B) Graph B.
C) Graph C.
D) Graph D.
Correct Answer:

Verified
Correct Answer:
Verified
Related Questions
Q22: For a given increase in price, a
Q90: The federal government's "Cash For Clunkers" program
Q115: An increase in demand will increase the
Q201: According to the law of supply, other
Q237: Suppose the equilibrium price of bread is
Q238: If the demand curve for a life-saving
Q240: Figure 4-E <img src="https://d2lvgg3v3hfg70.cloudfront.net/TB5765/.jpg" alt="Figure 4-E
Q243: Ceteris paribus, if an 8% increase in
Q244: The face value of a ticket to
Q245: A perfectly inelastic supply curve is:<br>A)upward sloping