Multiple Choice
Exhibit 4-C 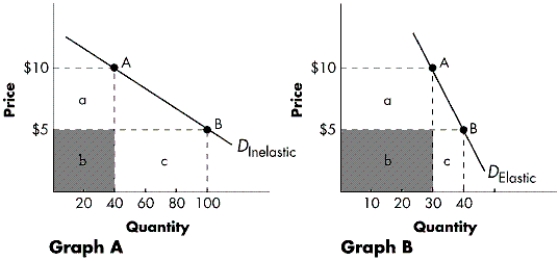
-Refer to Exhibit 4-C.Graph A represents a demand curve that is relatively ____.Total revenue ____ as the price decreases from $10 to $5.
A) inelastic; decreases
B) elastic; decreases
C) elastic; increases
D) inelastic; increases
Correct Answer:

Verified
Correct Answer:
Verified
Q39: Two goods are complements if an increase
Q56: Which of the following best explains the
Q131: Either an increase in the number of
Q183: If the government increased taxes on soft
Q185: Consumer surplus measures:<br>A)the total benefits received from
Q186: Table 4-D<br>Miles demands jazz CDs according
Q187: Figure 4-E <img src="https://d2lvgg3v3hfg70.cloudfront.net/TB5765/.jpg" alt="Figure 4-E
Q190: Ceteris paribus, if a 4% increase in
Q192: If the supply curve is perfectly inelastic,
Q193: Unlike its competitors, one glass producer can