Multiple Choice
Exhibit 4-C 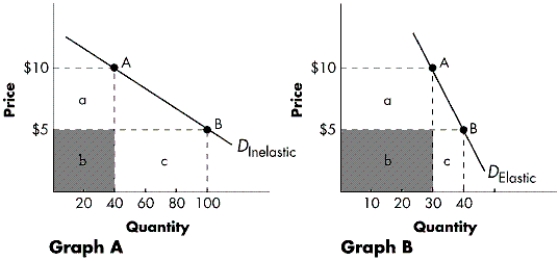
-Refer to Exhibit 4-C.With reference to Graph B, at a price of $5, total revenue equals:
A) $200.
B) $300.
C) $250.
D) $150.
Correct Answer:

Verified
Correct Answer:
Verified
Related Questions
Q14: If the government wanted to reduce the
Q15: A secondary effect of an action that
Q16: What type of demand curve is depicted
Q19: If the demand is perfectly inelastic, what
Q20: A decrease in the current minimum wage
Q21: Total revenue represents the amount that:<br>A)sellers receive
Q44: When both supply and demand shift in
Q102: Which of the following is true of
Q105: If the supply curve for a product
Q261: If the elasticity of demand coefficient for