Multiple Choice
Figure 4-A
The diagram below represents the market for butter. 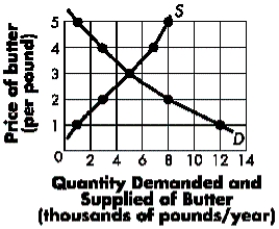
-Refer to Figure 4-A.If a price floor of $4 is imposed, ____ units of butter will be sold.
A) 7,000
B) 5,000
C) 4,000
D) 3,000
E) 2,000
Correct Answer:

Verified
Correct Answer:
Verified
Q56: Which of the following best explains the
Q130: When demand is elastic:<br>A)price elasticity of demand
Q167: Which of the following is not a
Q171: When a supply curve shifts,the equilibrium price
Q175: Evaluate the following statements: (I) The slope
Q177: Figure 4-E <img src="https://d2lvgg3v3hfg70.cloudfront.net/TB5765/.jpg" alt="Figure 4-E
Q178: If the supply curve for aspirin is
Q182: The area between the market price and
Q183: If the government increased taxes on soft
Q185: Consumer surplus measures:<br>A)the total benefits received from