Multiple Choice
Figure 4-A
The diagram below represents the market for butter. 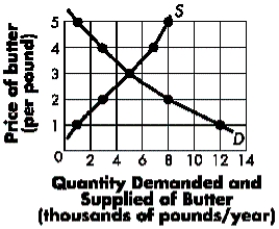
-Refer to Figure 4-A.If a price ceiling of $2 is imposed, ____ units of butter will be sold.
A) 8,000
B) 5,000
C) 4,000
D) 3,000
E) 2,000
Correct Answer:

Verified
Correct Answer:
Verified
Related Questions
Q5: Assume there is a price ceiling imposed
Q90: Which of the following is true about
Q104: If an increase in price causes total
Q147: A tax is imposed on wine.Sellers will
Q151: Based on the graph below, what is
Q154: Figure 4-D <img src="https://d2lvgg3v3hfg70.cloudfront.net/TB5765/.jpg" alt="Figure 4-D
Q155: Say that the equilibrium price of natural
Q156: Which of the following is true?<br>A)If the
Q208: For a normal good, if incomes rise,
Q219: How does the equilibrium quantity change when