Multiple Choice
Figure 4-B 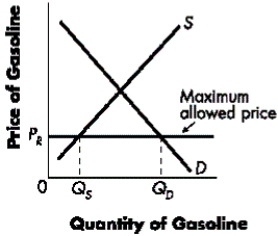
-Refer to Figure 4-B.The graph portrays the market for gasoline for which a ____ has been imposed, and, as a result, a ____ of gasoline occurs.
A) price floor; surplus
B) price ceiling; shortage
C) price ceiling; surplus
D) price floor; shortage
Correct Answer:

Verified
Correct Answer:
Verified
Related Questions
Q78: Based on the table below, what
Q81: If the government wanted a tax to
Q82: A jeweler cut prices in his store
Q87: If the demand curve is perfectly elastic,
Q88: Demand is said to be _ when
Q121: A decrease in demand will:<br>A)reduce total revenue.<br>B)increase
Q130: Which of the following is associated with
Q143: A government mandated price increase for doodads
Q147: Ceteris paribus, if the price of lumber
Q216: The longer the time period considered, the