Multiple Choice
Exhibit 17-4 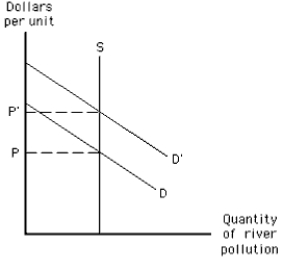
-The supply curve in Exhibit 17-4 represents the amount of
A) pollution individuals and firms want to dump into the river
B) the river that can still serve as a resource
C) pollution the river can accept
D) pollution the owner or manager of the resource is willing to clean up
E) the pollution-causing good supplied by the industry
Correct Answer:

Verified
Correct Answer:
Verified
Q5: Pollution taxes are paid out of the
Q7: Education confers positive externalities because<br>A)some education is
Q75: The marginal social benefit curve for water
Q81: If farmers decide individually whether or not
Q93: In the United States, what percentage of
Q96: Exhibit 17-6 <img src="https://d2lvgg3v3hfg70.cloudfront.net/TB4914/.jpg" alt="Exhibit 17-6
Q98: Exhibit 17-3 <img src="https://d2lvgg3v3hfg70.cloudfront.net/TB4914/.jpg" alt="Exhibit 17-3
Q101: Exhibit 17-2 <img src="https://d2lvgg3v3hfg70.cloudfront.net/TB4914/.jpg" alt="Exhibit 17-2
Q102: Exhibit 17-3 <img src="https://d2lvgg3v3hfg70.cloudfront.net/TB4914/.jpg" alt="Exhibit 17-3
Q202: Society's total cost of producing a good<br>A)includes