Multiple Choice
Exhibit 10-4 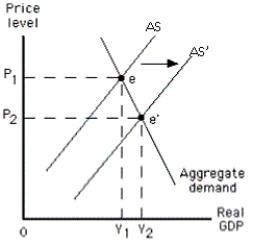
-The graph in Exhibit 10-4 shows a(n)
A) increase in short-run aggregate supply
B) increase in long-run aggregate supply
C) decrease in short-run aggregate supply
D) decrease in long-run aggregate supply
E) decrease in aggregate quantity demanded
Correct Answer:

Verified
Correct Answer:
Verified
Q1: Which of the following is true of
Q47: During a recession,output is<br>A)above potential and unemployment
Q48: Which of the following is true in
Q49: If the actual price level turns out
Q51: If the price level turns out to
Q53: A beneficial supply shock would shift the<br>A)long-run
Q54: Suppose that the real wage remained unchanged
Q55: If the actual price level is higher
Q56: Exhibit 10-5 <img src="https://d2lvgg3v3hfg70.cloudfront.net/TB4914/.jpg" alt="Exhibit 10-5
Q57: Which of the following is true of