Multiple Choice
Exhibit 10-7 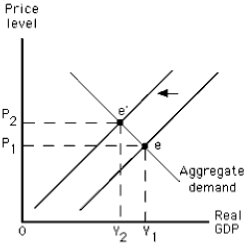
-The graph in Exhibit 10-7 shows a(n)
A) increase in short-run aggregate supply
B) increase in long-run aggregate supply
C) decrease in short-run aggregate supply
D) decrease in long-run aggregate supply
E) increase in aggregate quantity demanded
Correct Answer:

Verified
Correct Answer:
Verified
Q101: If nominal wage rates increase by 2
Q133: If the economy were at its potential
Q134: Increases in the costs of production will
Q135: Exhibit 10-12 <img src="https://d2lvgg3v3hfg70.cloudfront.net/TB4914/.jpg" alt="Exhibit 10-12
Q137: If global pollution causes climatic changes that
Q139: Which of the following would shift the
Q140: Real wages are nominal wages adjusted for
Q141: In long-run equilibrium,<br>A)actual output can exceed potential
Q142: Exhibit 10-2 <img src="https://d2lvgg3v3hfg70.cloudfront.net/TB4914/.jpg" alt="Exhibit 10-2
Q143: The aggregate supply curve reflects the relationship