Multiple Choice
Exhibit 10-9 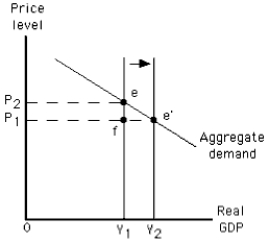
-The graph in Exhibit 10-9 shows a(n)
A) increase in short-run aggregate supply
B) increase in long-run aggregate supply
C) decrease in short-run aggregate supply
D) decrease in long-run aggregate supply
E) decrease in aggregate quantity demanded
Correct Answer:

Verified
Correct Answer:
Verified
Q67: In constructing a short-run aggregate supply curve,we
Q198: The capital stock increases<br>A)whenever money in circulation
Q199: Exhibit 10-11 <img src="https://d2lvgg3v3hfg70.cloudfront.net/TB4914/.jpg" alt="Exhibit 10-11
Q200: An adverse supply shock could increase both
Q201: If an economy is at its potential
Q202: If the expected price level exceeds the
Q204: If the economy were at its potential
Q205: During a recession,<br>A)unemployment is below the natural
Q206: A wage rate above what is necessary
Q207: Beneficial supply shocks include all of the