Multiple Choice
Exhibit 10-9 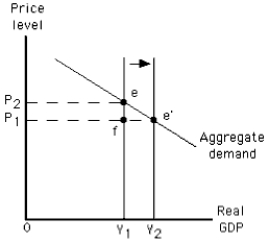
-The movement shown in Exhibit 10-9 could be caused by
A) a decrease in the size of the labor force
B) an increase in the price level
C) positive net investment
D) an increase in autonomous consumption
E) a decrease in autonomous consumption
Correct Answer:

Verified
Correct Answer:
Verified
Q81: At the potential level of output,there is
Q91: Given the aggregate demand curve,an adverse supply
Q92: In the long run,but not in the
Q94: Exhibit 10-2 <img src="https://d2lvgg3v3hfg70.cloudfront.net/TB4914/.jpg" alt="Exhibit 10-2
Q97: Exhibit 10-6 <img src="https://d2lvgg3v3hfg70.cloudfront.net/TB4914/.jpg" alt="Exhibit 10-6
Q98: The main effect of a decrease in
Q99: Actual output falls below potential output<br>A)during a
Q100: Potential output depends on all of the
Q121: The natural rate of unemployment includes frictional,cyclical,and
Q165: The potential output of an economy is