Multiple Choice
Exhibit 10-10 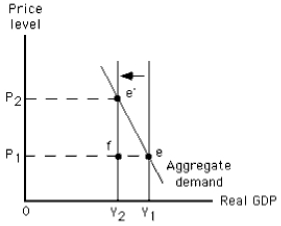
-The graph in Exhibit 10-10 shows a(n)
A) increase in long-run aggregate supply
B) increase in short-run aggregate supply
C) decrease in short-run aggregate supply
D) decrease in long-run aggregate supply
E) increase in aggregate quantity demanded
Correct Answer:

Verified
Correct Answer:
Verified
Q26: Suppose this year's inflation rate is 4
Q107: Exhibit 10-12 <img src="https://d2lvgg3v3hfg70.cloudfront.net/TB4914/.jpg" alt="Exhibit 10-12
Q108: In the short run,the price level is
Q110: The amount by which actual output falls
Q111: An increase in short-run aggregate supply could
Q113: Exhibit 10-10 <img src="https://d2lvgg3v3hfg70.cloudfront.net/TB4914/.jpg" alt="Exhibit 10-10
Q114: Exhibit 10-6 <img src="https://d2lvgg3v3hfg70.cloudfront.net/TB4914/.jpg" alt="Exhibit 10-6
Q115: As a contractionary gap is closed in
Q116: Which of the following is generally true
Q117: Increases in the costs of producing each