Multiple Choice
Exhibit 9-10 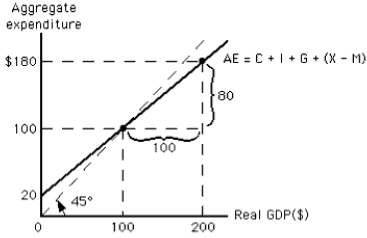
-According to the graph in Exhibit 9-10,if the price level increases,the new equilibrium level of real GDP must be
A) less than $20
B) less than $100
C) zero
D) greater than $100
E) greater than $200
Correct Answer:

Verified
Correct Answer:
Verified
Q104: Movement along the aggregate demand curve may
Q128: Exhibit 9-6<br> <span class="ql-formula" data-value="\begin{array}{l}\text {
Q129: What does the marginal propensity to consume
Q130: If current aggregate expenditure equals current production,the
Q132: An increase in autonomous investment will<br>A)shift the
Q134: Increases in the marginal propensity to consume,other
Q135: Suppose that planned autonomous investment increases by
Q136: The aggregate expenditure line,along with the 45-degree
Q137: If the price level decreases,other things constant,people
Q138: If there are no unintended changes in