Multiple Choice
Exhibit 9-10 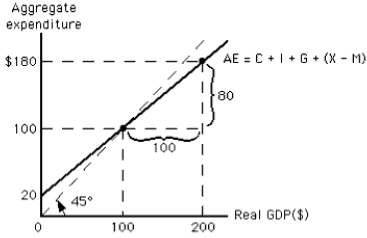
-According to the graph in Exhibit 9-10,if the price level decreases,the new equilibrium level of real GDP must be
A) less than $20
B) less than $100
C) unchanged
D) greater than $100
E) greater than $200
Correct Answer:

Verified
Correct Answer:
Verified
Q31: Exhibit 9-9 <img src="https://d2lvgg3v3hfg70.cloudfront.net/TB4914/.jpg" alt="Exhibit 9-9
Q32: To simplify the aggregate expenditure model,we assume
Q33: Consumption plus saving equals disposable income at
Q34: Which of the following is illustrated by
Q35: Which of the following is true about
Q37: Exhibit 9-6<br> <span class="ql-formula" data-value="\begin{array}{l}\text {
Q38: Which of the following is assumed constant
Q39: What is the effect of an increase
Q40: If households save $40 billion less at
Q41: Suppose that at a particular level of