Multiple Choice
Exhibit 5-3 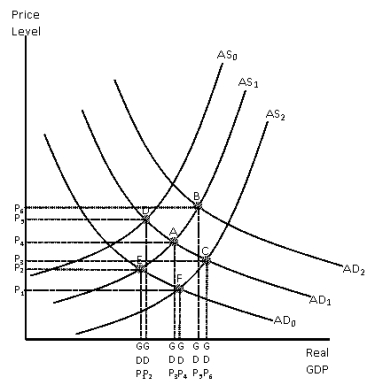
-In Exhibit 5-3 AD1 and AS1 represent the initial aggregate demand and aggregate supply.The initial equilibrium is at point A.Suppose that global oil prices rise,what will the new equilibrium be?
A) A
B) B
C) C
D) D
E) E
Correct Answer:

Verified
Correct Answer:
Verified
Q56: An increase in aggregate supply will result
Q57: Between 1947 and 2003,U.S.real GDP<br>A)hardly changed at
Q58: Exhibit 5-2 <img src="https://d2lvgg3v3hfg70.cloudfront.net/TB4914/.jpg" alt="Exhibit 5-2
Q59: Exhibit 5-1 <img src="https://d2lvgg3v3hfg70.cloudfront.net/TB4914/.jpg" alt="Exhibit 5-1
Q60: Exhibit 5-1 <img src="https://d2lvgg3v3hfg70.cloudfront.net/TB4914/.jpg" alt="Exhibit 5-1
Q62: Between 1947 and 1998,total U.S.employment<br>A)remained about the
Q63: If business leaders become pessimistic about future
Q64: Given an aggregate supply curve that slopes
Q65: Which of the following was a central
Q66: On an aggregate demand and aggregate supply