Multiple Choice
Exhibit 1-1 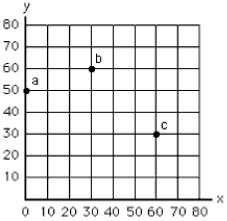
-In Exhibit 1-1 the movement from point b to point c represents
A) an increase in x of 30 units and an increase in y of 10 units
B) an increase in x of 10 units and an increase in y of 30 units
C) an increase in x of 60 units and a decrease in y of 20 units
D) an increase in x of 20 units and a decrease in y of 60 units
E) an increase in x of 20 units and a decrease in y of 30 units
Correct Answer:

Verified
Correct Answer:
Verified
Q5: Exhibit 1-2 <img src="https://d2lvgg3v3hfg70.cloudfront.net/TB4914/.jpg" alt="Exhibit 1-2
Q10: Exhibit 1-5 <img src="https://d2lvgg3v3hfg70.cloudfront.net/TB4914/.jpg" alt="Exhibit 1-5
Q11: Exhibit 1-4 <img src="https://d2lvgg3v3hfg70.cloudfront.net/TB4914/.jpg" alt="Exhibit 1-4
Q14: Exhibit 1-5 <img src="https://d2lvgg3v3hfg70.cloudfront.net/TB4914/.jpg" alt="Exhibit 1-5
Q16: A tangent line is a straight line<br>A)that
Q38: A functional relationship exists between two variables
Q54: Suppose a graph with Ron's weight on
Q61: If slope = 2 for a line
Q66: Moderate exercise is better than none, but
Q68: A downward-sloping straight line has a decreasing