Multiple Choice
Exhibit 1-16 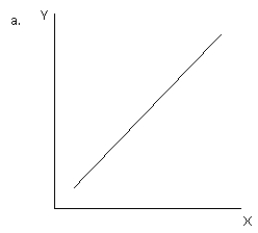
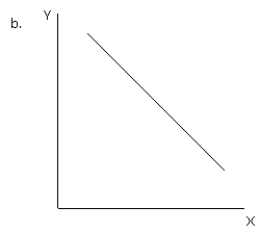
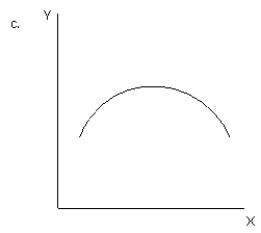
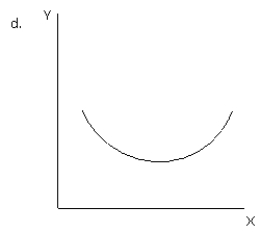
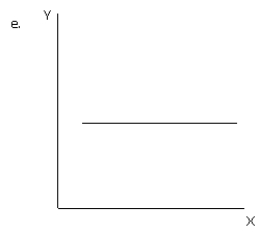
-Refer to Exhibit 1-16.Which graph illustrates a negative relationship between variable X and variable Y initially but then a positive relationship?
A) a
B) b
C) c
D) d
E) e
Correct Answer:

Verified
Correct Answer:
Verified
Q7: The slope of a vertical straight line
Q12: The slope of a U-shaped curve is
Q30: Exhibit 1-2 <img src="https://d2lvgg3v3hfg70.cloudfront.net/TB4914/.jpg" alt="Exhibit 1-2
Q32: Exhibit 1-2 <img src="https://d2lvgg3v3hfg70.cloudfront.net/TB4914/.jpg" alt="Exhibit 1-2
Q34: Exhibit 1-16 <img src="https://d2lvgg3v3hfg70.cloudfront.net/TB4914/.jpg" alt="Exhibit 1-16
Q35: Exhibit 1-7 <img src="https://d2lvgg3v3hfg70.cloudfront.net/TB4914/.jpg" alt="Exhibit 1-7
Q37: A curved line may have a positive
Q55: Ron weighs 150 pounds.A graph relating Ron's
Q58: On a graph, the origin represents<br>A)the dependent
Q60: If slope = -2 for a line