Multiple Choice
In the graph below, which depicts the relationship between units produced and total cost, the dotted line depicts which type of total cost? 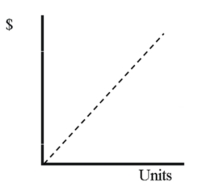
A) Variable cost
B) Fixed cost
C) Mixed cost
D) None of these
Correct Answer:

Verified
Correct Answer:
Verified
Related Questions
Q1: Goff Corporation sells products for $75 each
Q15: Operating leverage enables a company to convert
Q19: Southern Food Service operates six restaurants in
Q112: Costs that might be incurred by service,
Q115: Which of the following statements regarding Company
Q116: Select the incorrect statement regarding the contribution
Q116: The following information is for Companies
Q120: If revenues are expected to decline,management should
Q137: What is the break-even point for a
Q144: Select the incorrect statement regarding fixed and