Multiple Choice
In the graph below, which depicts the relationship between units produced and unit cost, the dotted line depicts which type of cost per unit? 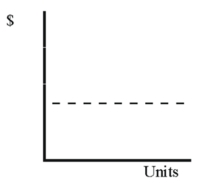
A) Variable cost
B) Fixed cost
C) Mixed cost
D) None of these
Correct Answer:

Verified
Correct Answer:
Verified
Related Questions
Q2: Select the incorrect statement regarding the relevant
Q48: When selecting the high and low observations
Q52: What is an activity base,and how does
Q119: What is operating leverage,and how does a
Q127: A cost that is considered variable for
Q136: Select the correct statement regarding the contribution
Q141: Based on the following cost data,
Q147: The following income statement is provided
Q149: What is the formula for calculating contribution
Q151: Yankee Tours provide seven-day guided tours along