Multiple Choice
In the graph below, which depicts the relationship between units produced and total cost, the dotted line depicts which type of total cost? 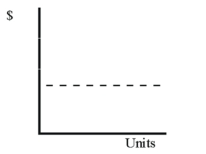
A) Variable cost
B) Fixed cost
C) Mixed cost
D) None of these
Correct Answer:

Verified
Correct Answer:
Verified
Related Questions
Q5: What are mixed or semivariable costs? Give
Q34: The higher the magnitude of a company's
Q35: Gamble Company has contribution margin of $20
Q40: Once sales reach the break-even point,each additional
Q61: Companies A and B are in the
Q123: To attain a target profit,the total gross
Q129: In order to prepare a contribution format
Q132: Columbus Industries makes a product that sells
Q136: The following income statements are provided for
Q138: Rocky Mountain Bottling Company produces a soft