Multiple Choice
Figure 6.1: Romer Model: Per Capita Output 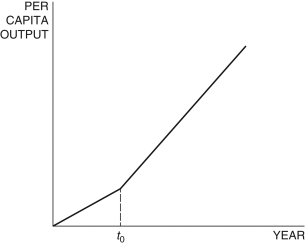
-In the Romer model in Figure 6.1, at time t0, a change in the growth rate of per capita output can be explained by:
A) a decrease in the ideas efficiency parameter
B) an increase in the population
C) an increase in the research share
D) an increase in the saving rate
E) a decrease in the population
Correct Answer:

Verified
Correct Answer:
Verified
Q29: In the combined Solow-Romer model, the steady-state
Q39: In the Romer model, the inputs to
Q104: Suppose the parameters of the Romer
Q106: In economics, a rival good is one
Q108: The production function in the Romer
Q109: With the production function <span
Q110: In the Romer model, the production
Q112: Consider the Cobb-Douglas production function
Q113: Because, in many industries the cost of
Q114: The production of new ideas in the