Multiple Choice
Figure 6.2: Romer Model: Per Capita Output 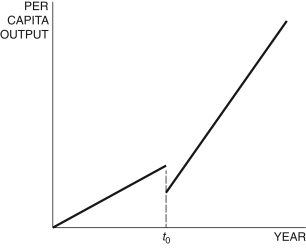
-In the Romer model in Figure 6.2, at time t0, a change in the shape of the production function can be explained by:
A) an increase in the population
B) an increase in the research share
C) an increase in the ideas efficiency parameter
D) an increase in the saving rate
E) an increase in the growth rate
Correct Answer:

Verified
Correct Answer:
Verified
Q8: How does the Romer model of economic
Q72: "Growth accounting" endeavors to:<br>A) measure GDP.<br>B) measure
Q73: In the Romer model, the growth
Q74: If East and West Timor are identical
Q75: In the growth accounting equation for
Q78: The Romer model might be better explained
Q79: The production function <span class="ql-formula"
Q81: The parameter(s) in the Romer model is/are:<br>A)
Q82: In the Romer model, _ is
Q102: There is no difference between the stock