Multiple Choice
Refer to the following figure to answer
Figure 7.1: U.S. Unemployment Rate: 1975-2012 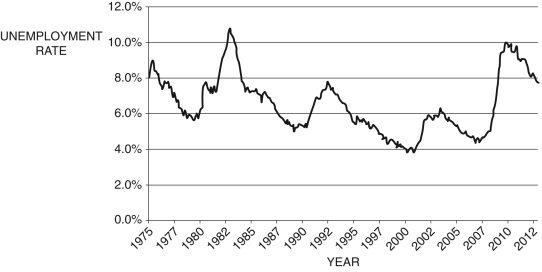 (Source: U.S. Bureau of Labor Statistics)
-Using Figure 7.1, which of the following year(s) are the trough of a recession?
A) 2001
B) 1983
C) 1979
D) 2012
E) All of these answers are correct.
Correct Answer:

Verified
Correct Answer:
Verified
Q13: The labor demand curve is derived from
Q28: Structural unemployment is the unemployment that results
Q29: Because of the dynamics of the workforce,
Q30: Consider the data in Table 7.3.
Q31: The labor market determines:<br>A) the equilibrium wage<br>B)
Q36: Any institutional fixed wage set above the
Q38: A key reason that unemployment in the
Q42: The natural rate of unemployment is equal
Q89: If the number of employed is 145,926,
Q102: Beginning in _, the wage premium began