Multiple Choice
Refer to the following figure when answering the next five questions.
Figure 9.2: U.S. Output Fluctuations 1960-2012 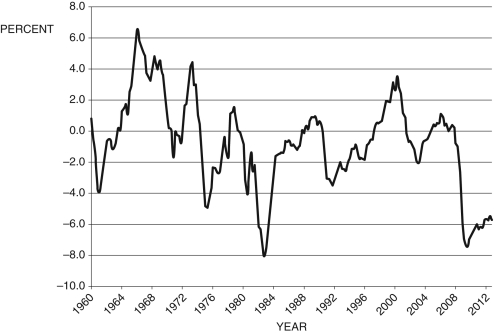
(Source: BEA and CBO, data from Federal Reserve Economic Data, St. Louis Federal Reserve)
-Consider Figure 9.2. In 1989, the U.S. economy experienced an economic ________, and current output was about ________ potential output.
A) boom; 1 percent above
B) recession; 1 percent above
C) boom; 2 percent above
D) This cannot be determined from the information given.
E) None of these answers are correct.
Correct Answer:

Verified
Correct Answer:
Verified
Q32: According to the text, the slope of
Q55: Which of the following is NOT an
Q59: Output fluctuations are defined as:<br>A) the amount
Q71: The short-run model determines _ and _.<br>A)
Q78: Defining <span class="ql-formula" data-value="Y _
Q81: The relationship between actual output in an
Q85: Generally speaking, the rate of inflation _
Q86: If output is above potential, so
Q87: According to the text, the slope of
Q101: How is a recession "officially" determined?