Multiple Choice
Refer to the following figure when answering the next five questions.
Figure 9.2: U.S. Output Fluctuations 1960-2012 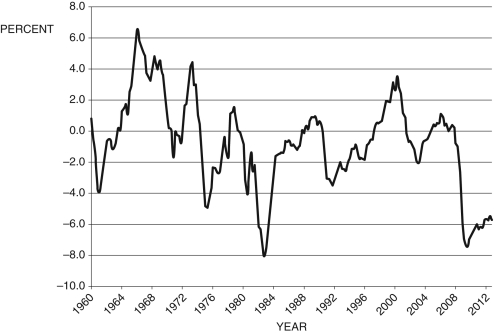
(Source: BEA and CBO, data from Federal Reserve Economic Data, St. Louis Federal Reserve)
-Consider Figure 9.2, which represents . In approximately what years did the U.S. economy experience its longest economic downturn, using the text's definition?
A) 1990-1997
B) 1974-1978
C) 1980-1988
D) 1957-1963
E) 2008-2012
Correct Answer:

Verified
Correct Answer:
Verified
Q1: If <span class="ql-formula" data-value="\tilde {
Q7: John Maynard Keynes is famous for saying,
Q7: You are a staff economist with the
Q8: If <span class="ql-formula" data-value="\Delta \pi
Q13: A country with a steep Phillips curve
Q34: Post-World War II, the deepest recessionary gap
Q86: You are a staff economist with the
Q93: According to the Phillips curve presented in
Q103: Refer to the following figure when answering
Q107: Which is responsible for dating business cycles?<br>A)