Essay
Figure 9.6: The Output Gap 1980-2012 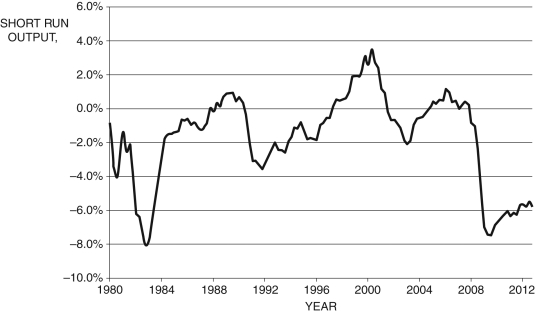 (SOURCE: Federal Reserve Economic Data, St. Louis Federal Reserve)
-Figure 9.6 above shows the output gap for the years 1980-2012. Using the Phillips curve and Okun's law, discuss the impacts on inflation and unemployment for the years 1997-2000 and 2008-2012. From this analysis, what is the relationship between unemployment and inflation?
Correct Answer:

Verified
The Phillips curve is the positive relat...View Answer
Unlock this answer now
Get Access to more Verified Answers free of charge
Correct Answer:
Verified
View Answer
Unlock this answer now
Get Access to more Verified Answers free of charge
Q5: According to the Phillips curve presented in
Q23: In 1979, the inflation rate reached about
Q60: What does Okun's law state?
Q89: Figure 9.5: Economic Boom versus Recession <img
Q90: Refer to the following figure when answering
Q91: The short-run model is built on which
Q92: Refer to the following figure when
Q94: If <span class="ql-formula" data-value="\tilde {
Q96: If <span class="ql-formula" data-value="\Delta \pi
Q101: How is a recession "officially" determined?