Essay
Figure 10.2 shows the U.S. housing price index (solid line, left axis) and one year adjustable mortgage rates-a proxy for subprime loans (dashed line, right axis). In the context of the housing and financial crisis, discuss the relationship between these two series.
Figure 10.2: Housing prices and one-year adjustable mortgage rates 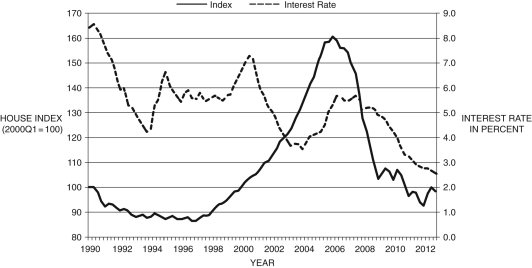
(Source: Federal Reserve Economic Data, St. Louis Federal Reserve)
Correct Answer:

Verified
The answer will depend on the student; h...View Answer
Unlock this answer now
Get Access to more Verified Answers free of charge
Correct Answer:
Verified
View Answer
Unlock this answer now
Get Access to more Verified Answers free of charge
Q7: According to The Economist, in 2006, approximately
Q17: _ peaked at the end of _.
Q24: In the middle of 2009, _; by
Q47: Between 1996 and 2006, housing prices averaged
Q56: The federal funds rate is the rate
Q63: Refer to the following table when
Q65: When all depositors converge on a bank
Q67: Refer to the following table when
Q69: Refer to the following table when
Q93: During the Great Recession, inflation was relatively