Multiple Choice
The following figure shows the BAA corporate and 10-Year Treasury Bond yields. Refer to this figure when answering
Figure 14.1: BAA and 10-Year Bonds, 2006-2010 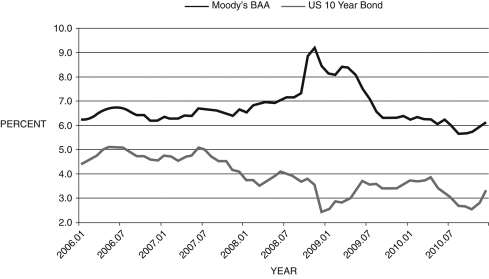
(Source: Federal Reserve Economic Data, St. Louis Federal Reserve)
-Consider Figure 14.1 above. The difference between these two curves can be interpreted as:
A) the financial friction
B) inflation expectations
C) the risk-free rate
D) a market imperfection
E) the prime lending rate
Correct Answer:

Verified
Correct Answer:
Verified
Q18: The March 20, 2013, Federal Open Market
Q57: The European debt crisis hit all of
Q83: Figure 14.1: BAA and 10-Year Bonds, 2006-2010
Q88: The federal budget deficit _ in 2009
Q89: The effect of the subprime loan crisis
Q91: The burst of the housing bubble
Q92: The return to a risky asset
Q94: Which of the following financial reforms were
Q95: The difference between the 3-month bond yield
Q97: In the aftermath of the recent financial