Multiple Choice
The following figure shows the BAA corporate and 10-Year Treasury Bond yields. Refer to this figure when answering
Figure 14.1: BAA and 10-Year Bonds, 2006-2010 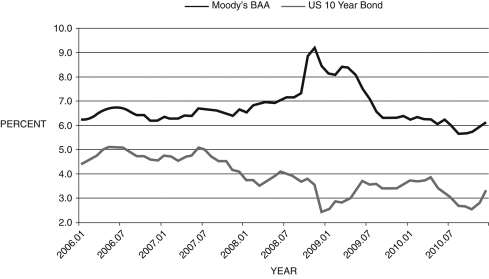
(Source: Federal Reserve Economic Data, St. Louis Federal Reserve)
-In Figure 14.1 above, the 10-year bond yield is considered ________, while the BAA bond yield represents ________.
A) the federal funds rate; the financial friction
B) the saving rate; the lending rate
C) the financial friction; the prime lending rate
D) a risk-free interest rate; a risky interest rate
E) inflation; the M1 money growth rate
Correct Answer:

Verified
Correct Answer:
Verified
Q7: The following figure shows the inflation rate
Q8: The Taylor rule predicted federal funds
Q13: When a financial friction is added to
Q25: Bailouts of the financial sector:<br>A) worsen the
Q31: The average P/E ratio over the past
Q34: When an economy is in a deflationary
Q35: The Monetary History of the United States,
Q40: In the aftermath of the recent financial
Q70: In the AS/AD framework, the financial friction
Q93: The relatively high growth rate of money