Multiple Choice
The following figure shows the BAA corporate and 10-Year Treasury Bond yields. Refer to this figure when answering
Figure 14.1: BAA and 10-Year Bonds, 2006-2010 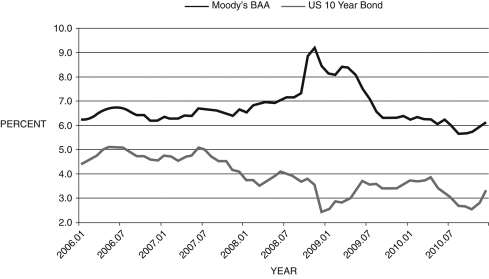
(Source: Federal Reserve Economic Data, St. Louis Federal Reserve)
-In Figure 14.1 above, the financial friction in late 2008 was about ________ percent.
A) 9.5
B) 11
C) 6
D) -7
E) Not enough information is given.
Correct Answer:

Verified
Correct Answer:
Verified
Q17: In a paper by Minneapolis Fed bank
Q18: The March 20, 2013, Federal Open Market
Q21: What did the Fed chairman tell a
Q73: When a financial institution is deemed too
Q82: When an economy is in a deflationary
Q86: According to the Fisher equation, the
Q87: The Fisher equation is given by:<br>A)
Q88: The federal budget deficit _ in 2009
Q89: The effect of the subprime loan crisis
Q102: In the aftermath of the financial crisis