Multiple Choice
The following figure shows the inflation rate and ten-year bond yield. Refer to this figure when answering
Figure 14.4: Inflation and 10-Year Bond Yields 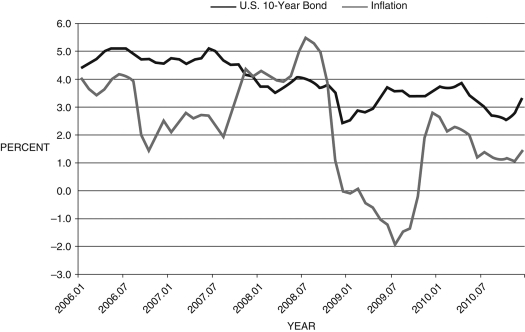
-Consider Figure 14.4 above. For most of 2008 the:
A) real interest rate was negative
B) 10-year-bonds' nominal interest rate was less than the real interest rate
C) real interest rate was zero
D) real interest rate was positive
E) None of these answers are correct.
Correct Answer:

Verified
Correct Answer:
Verified
Q6: The Monetary History of the United States,
Q38: The Troubled Asset Relief Program was originally
Q50: In response to the financial crisis, the
Q54: If the rate of inflation is -2
Q55: Between approximately 2001 and 2006, the Taylor
Q56: Adding the financial friction to the AS/AD
Q66: In standard circumstances a firm _ when
Q74: When there is deflation:<br>A) the central bank
Q90: The effect of the subprime loan crisis
Q103: The financial friction:<br>A) is equal to zero