Essay
Consider Figure 14.6 below. Discuss the relationship between these two series, with particular attention to the Fisher equation.
Figure 14.6: U.S. 10-Year Bond Yield and Inflation 2006-2010 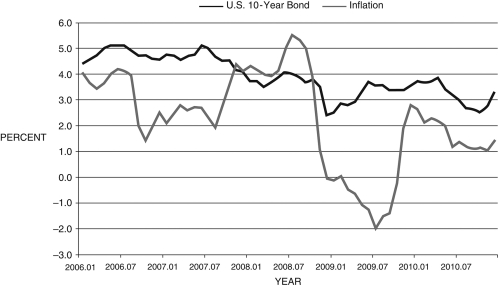
(Source: Federal Reserve Economic Data, St. Louis Federal Reserve)
Correct Answer:

Verified
The Fisher equation is the relationship ...View Answer
Unlock this answer now
Get Access to more Verified Answers free of charge
Correct Answer:
Verified
View Answer
Unlock this answer now
Get Access to more Verified Answers free of charge
Q7: A constraint to complicated macroeconomic models has
Q20: The rapid growth of money supply, M1
Q23: When a financial friction is added
Q24: In dollars, the magnitude of the Fed's
Q31: The average P/E ratio over the past
Q70: In the AS/AD framework, the financial friction
Q71: The Troubled Asset Relief Program was originally
Q82: The high growth rates of money in
Q85: The Squam Lake Group's reform suggestions included
Q89: The Fed's balance sheet normally consists of:<br>A)