True/False
Figure 16.5: Personal Savings Rate 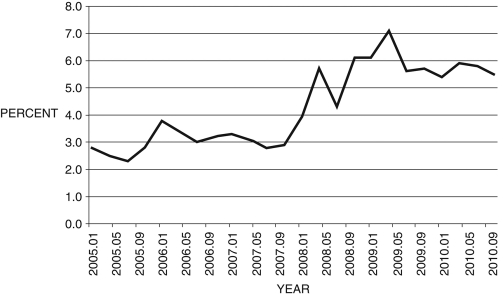 (Source: Federal Reserve Economic Data, St. Louis Federal Reserve)
-Consider Figure 16.5. A likely explanation for the rise in savings rates beginning in 2007 is the continued strength in stock and housing markets.
Correct Answer:

Verified
Correct Answer:
Verified
Q35: If consumption exhibits diminishing marginal utility, then:<br>A)
Q37: The consumer chooses his or her _
Q64: If the government lowers taxes to stimulate
Q65: Consider two time periods: t and
Q66: Consider consumption in two periods,
Q69: Figure 16.7: Personal Savings Rates <img src="https://d2lvgg3v3hfg70.cloudfront.net/TB4306/.jpg"
Q71: Which of the following represents the
Q73: If <span class="ql-formula" data-value="\beta (
Q74: If you live T periods,
Q75: Refer to the following figure when answering